|
Statistical Concepts and Market Return (Reading 7)
|
|
|
Learning Outcome Statements (LOS)
|
|
|
a |
Distinguish between descriptive statistic and inferential statistics, between a population and a sample, and among the types of measurement scales: Descriptive statistics summarize the characteristics of a data set; inferential statistics are used to make probabilistic statements about a population based on a sample. A population includes all members of a specified group, while a sample is a subset of the population used to draw inferences about the population. Data may be measured using different scales. · Nominal scale---data is put into categories that have no particular. · Ordinal scale---data is put into categories that can be ordered with respect to some characteristic. · Interval scale---difference in data values are meaningful, but ratios, such as twice as much or twice as large, are not meaningful · Ratio scale---ratios of value, such as twice as much or half as large, are meaningful, and zero represents the complete absence of the characteristic being measured.
|
|
b |
Define a parameter, a sample statistic, and frequency distribution: Any measurable characteristic of population is called a parameter. A characteristic of a sample is given by a sample statistic. A frequency distribution groups observations into classes, or intervals. An interval is a range of values.
|
|
c |
Calculate and interpret relative frequencies and cumulative relative frequencies, given a frequency distribution: Relative frequency is the percentage of total observations falling within an interval. Cumulative relative frequency for an interval is the sum of the relative frequencies for all values less than or equal to that interval’s maximum value.
|
|
d |
Describe the properties of a data set presented as a histogram or a frequency polygon: A histogram is a bar chart of data that has been grouped into a frequency distribution. A frequency polygon plots the midpoint of each interval on the horizontal axis and the absolute frequency for that interval on the vertical axis, and connects the midpoints with straight lines. The advantage of histograms and frequency polygons is that we can quickly see where most of the observations lie.
|
|
e |
Calculate and interpret measures of central tendency, including the population mean, sample mean, arithmetic mean, weighted average or mean, geometric mean, harmonic mean, median, and mode:
The arithmetic mean
is the average.
The
geometric mean is used to find a compound growth rate.
The
weighted mean weights each value according to its influence.
The
harmonic mean can be used to find an average purchase price, such as dollars
per share for equal periodic investments. The median is the midpoint of a data set when the data is arranged from largest to smallest.
|
|
f |
Calculate and interpret quartiles, quintiles, deciles, and percentiles: Quantile is the general term for a value at or below which a stated proportion of the data in a distribution lies. Examples of quantiles include: · Quartiles---the distribution is divided into quarter. · Quintile---the distribution is divided into fifths. · Decile---the distribution is divided into tenths. · Percentile---the distribution is divided into hundredths.
|
|
g |
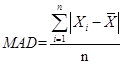
Calculate and interpret 1) a range and a mean absolute deviation and 2) the variance and standard deviation of a population and of a sample: The range is the difference between the largest and smallest values in a data set. Mean absolute deviation (MAD) is the average of the absolute values of the deviations from the arithmetic mean:
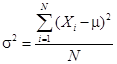
Variance is defined as the mean of the squared deviations from the arithmetic mean or from the expected value of a distribution.
· Population
variance
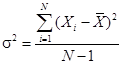
· Sample
variance Standard deviation is the positive square root of the variance and is frequently used as a quantitative measure of risk.
|
|
h |
Calculate and interpret the proportion of observations falling within a specified number of standard deviations of the mean using Chebyshev’s inequality: Chebyshev’s inequality states that the proportion of the observations within k standard deviations of the mean is at least 1-1/k2 for all k>1. It states that for distribution, at least: 36% of observations lie within +/- 1.25 standard deviations of the mean. 56% of observations lie within +/- 1.5 standard deviations of the mean. 75% of observations lie within +/- 2 standard deviations of the mean. 89% of observations lie within +/- 3 standard deviations of the mean. 94% of observations lie within +/- 4 standard deviations of the mean.
|
|
i |
Calculate and interpret the coefficient of variation and the Sharpe ratio:
The coefficient of
variation for sample data, The Sharpe ratio measures excess return per unit of risk:
Sharpe
ratio
|
|
j |
Explain skewness and the meaning of a positive or negatively skews return distribution: Skewness describes the degree which a distribution is not symmetric about mean. A right-skewed distribution has positive skewness. A left-skewed distribution has negative skewness. Sample skew with an absolute value great than 0.5 is consider significantly different from zero. |
|
k |
Describe the relative locations of the mean, median, and mode for a unimodal, nonsymmetrical distribution: For a positively skewed, unimodal distribution, the mean is greater than the median, which is greater than the mode. For a negatively skewed, unimodal distribution, the mean is less than the median, which is less than the mode.
|
|
l |
Explain measures of sample skewness and kurtosis: Kurtosis measures the peakedness of a distribution and the probability of extreme outcome. · Excess kurtosis is measured relative to a normal distribution, which has a kurtosis of 3 · Positive value of excess kurtosis indicate a distribution that is leptokurtic (fat tails, more peaked) so that the probability of extreme outcomes is greater than for a normal distribution. · Negative values of excess kurtosis indicate a platykurtic distribution (thin tails, less peaked). · Excess kurtosis with an absolute value greater than 1 is considered significant.
|
|
m |
Explain the use of arithmetic and geometric means when analyzing investment returns: The arithmetic mean return is appropriate for forecasting single period returns in future periods, while the geometric mean is appropriate for forecasting future compound returns over multiple periods.
|


|
Formulas:
|
||||||||||||||||||||||
|
Exercise Problems:
|
||||||||||||||||||||||
|
1. Victor Chow, CFA, makes two statements while comparing the use of geometric means and arithmetic means: Statement 1: the arithmetic mean is usually less than the geometric mean because of variance in the input data and compounding. Statement 2: the geometric mean should be used when estimating future returns because it takes into consideration the potential for all possible outcomes. As to the comments regarding use of geometric and arithmetic means: A. Only Statement 2 is accurate B. Both statements are accurate C. Both statements are inaccurate
|
Ans: C; The
arithmetic mean is the average. From the formula, the arithmetic mean is usually larger than the geometric mean. So statement 1 is incorrect. The geometric mean should be used when comparing historical returns; while arithmetic mean should be used when estimating future investment returns. So statement 2 is incorrect. |
|||||||||||||||||||||
|
2. A subset of a population is best described as a: A. Statistic. B. Sample. C. Frequency distribution.
|
Ans: B; a population is defined as all members of a specified group. The subset of a population is sample. A is incorrect; statistic (or sample statistic) is a quantity computed from or used to describe a sample. C is incorrect; a frequency distribution is a tabular display of data summarized into a relatively small number of intervals.
|
|||||||||||||||||||||
|
3. Nan Chen gathers the EPS for the firms in the S&P 500 and then ranks the firms from highest to lowest EPS. She than assigns the number 1 to the group with the highest EPS, the number 2 to the group with the second highest EPS, and so on. The measurement scale used by her is best described as: A. Ordinal. B. Nominal. C. Interval.
|
|
Ans: A; Nominal scales represent the weakest level of measurement: they categorize data but not rank them. Ordinal scales reflect a strong level of measurement: they sort data into categories that are ordered with respect to some characteristic. Interval scales provide not only ranking but also assurance that the differences between scale values are equal. As a result, scale values can be added and subtracted meaningfully. Ratio scales represent the strongest level of measurement. They have all the characteristic of interval measurement scale as well as a true zero point as the origin. So in this problem, Nan Chen categories these firms by EPS and ranks them, so she should use Ordinal scale.
|
||||||||||||||||||||
|
4. Below are some raw data displayed in increasing order from top to bottom and left to right. 162.7 195.3 210.4 235.7 166.2 198.0 216.7 237.5 175.4 199.9 217.0 238.9 177.7 200.1 217.7 240.9 184.6 203.0 222.2 244.1 187.4 204.9 222.8 244.9 189.8 209.7 229.5 255.5 In constructing a frequency distribution using five intervals of equal range, if the first interval is “160.0-179.9,” the class frequency of the third interval is closest to? A. 4 B. 6 C. 8
|
|
Ans: C ; the data intervals and frequency of observations are:
There are 8 observations in the third frequency interval. |
||||||||||||||||||||
|
5. Consider the following 20 items.
The median and mode of the items are: Median Mode A. 4 3 B. 3 5 C. 5 3
|
|
Ans: A; the median is the value of the middle item of a set of items that has been sorted into ascending or descending order. In an odd-numbered sample of n items, the median occupies the (n+1)/2 position. In an even-numbered sample of n items, we define the median as the mean of the values of items occupying the n/2 and the (n+2)/2 positions. So in this problem, median is (3+5)/2=4. The mode is the most frequently occurring value in a distribution. In this problem, mode is 3. |
||||||||||||||||||||
|
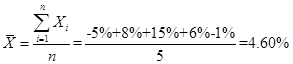
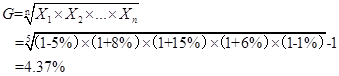
6. Over the past five years, Bao Capital experienced return of -5%, 8%, 15%, 6%, and -1%. The arithmetic mean return and the geometric mean return of the portfolio over the five year period is closest to: Arithmetic Geometric A. 4.60% 4.37% B. 4.60% 5.14% C. 4.37% 5.14%
|
|
Ans: A; according to the formula,
.
|
||||||||||||||||||||
|
7. The following ten observations are a sample drawn from a normal population: 20, 17, 15, -4, 6,-18, 24, 7, -9, and -2. The third quintile of the sample is closest to: A. 7 B. 11 C. 11.8 |
|
Ans: C; Quantile is the general term for a value at or below which a stated proportion of the data in a distribution lies. Examples of quantiles include: · Quartiles---the distribution is divided into quarter. · Quintile---the distribution is divided into fifths. · Decile---the distribution is divided into tenths. · Percentile---the distribution is divided into hundredths.
The formula is
In this
problem,
|
||||||||||||||||||||
|
8. Yang Liu gathered the following annual return information about a portfolio since its inception on 2008:
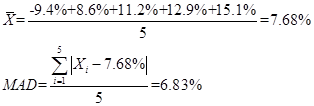
The portfolio’s mean absolute deviation for the five-year period is closest to: A. 3.76% B. 6.83% C. 7.68%
|
|
Ans: B; Mean absolute deviation (MAD) is the average of the absolute values of the deviations from the arithmetic mean:
So in this problem,
|
||||||||||||||||||||
|
9. A sample of 500 observations is randomly selected from a population. The mean of the sample is 400 and the standard deviation is 15. Based on Chebyshev’s inequality, the endpoints of the interval that must contain at least 75% of the observations are closest to: A. 377.5 and 422.5 B. 370 and 430 C. 355 and 445
|
|
Ans: B; Chebyshev’s inequality states that the proportion of the observations within k standard deviations of the mean is at least 1-1/k2 for all k>1. It states that for distribution, at least: 36% of observations lie within +/- 1.25 standard deviations of the mean. 56% of observations lie within +/- 1.5 standard deviations of the mean. 75% of observations lie within +/- 2 standard deviations of the mean. 89% of observations lie within +/- 3 standard deviations of the mean. 94% of observations lie within +/- 4 standard deviations of the mean.
So in this
problem the endpoints should be
|
||||||||||||||||||||
|
10. For and investment portfolio, the coefficient of variation of the returns on the portfolio is best described as measuring: A. Risk per unit of mean return. B. Mean return per unit of risk. C. Mean excess return per unit of risk.
|
|
Ans: A; The
coefficient of variation for sample data
|
||||||||||||||||||||
|
11. An analyst gathered the following information about a common stock portfolio:
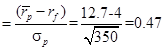
If the risk-free rate of return is 4%, then the coefficient of variation and Sharpe ratio is closest to: CV Sharpe ratio A. 1.63 0.40 B. 1.47 0.40 C. 1.47 0.47
|
|
Ans: C; The
coefficient of variation for sample data The Sharpe ratio measures excess return per unit of risk:
Sharpe ratio
|
||||||||||||||||||||
|
12. If the mode is equal, an investor would most likely prefer portfolios with return distributions that have: A. Positive skewness. B. Negative skewness. C. High excess kurtosis. |
|
Ans: A; in positive skewed distribution, the average return falls to the right of the mode, while average return falls left in negative skewed distribution. So investor will choose distribution with positive distribution to get higher average return. C is incorrect; Positive value of excess kurtosis indicate a distribution that is leptokurtic (fat tails, more peaked) so that investor may suffer greater loss than normal distribution.
|
||||||||||||||||||||
|
13. If a probability distribution is very similar to a normal distribution, then the kurtosis is best described as: A. Leptokurtic B. Mesokurtic C. Platykurtic |
|
Ans: B; kurtosis is the statistical measure that tells us when a distribution is more or less peaked than a normal distribution. A distribution identical to the normal distribution is called Mesokurtic. A is incorrect; a distribution that is more peaked than normal is called leptokurtic. C is incorrect; a distribution that is less peaked than normal is called platykurtic.
|
||||||||||||||||||||


移动客户端:iPhone版 iPad版 安卓版,
助你随时随地、离线学习!